Description
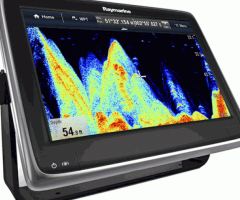
a127 Multifunction Touch Display with Built-In Digital Sonar
The a127 Multifunction Touch Display is the perfect all-in-one choice for cruising boats or coastal anglers. It combines all the GPS-chartplotter features of the a125, plus adds built-in, dual frequency (50/200 kHz) 600-watt digital sonar capable of targeting fish to depths of 3,000 feet. Add the compatible transducer of your choice (sold separately) to compete the system.
The a127 features a super-bright 12.1-inch sunlight viewable LCD screen with multitouch pinch-to-zoom control. Running Raymarine’s LightHouse II user interface, it is a full featured GPS and chartplotter that is compatible with both Navionics charts as well as LightHouse Raster and Vector charts of the USA.
Expand the a127’s capabilities by connecting it to other Raymarine MFDs and accessories. The a127 features dual RayNet network ports for connecting to other displays, radar, sonar, thermal cameras, SiriusXM Marine Weather receivers and much more. The a127 is also SeaTalkng and NMEA2000 compatible for connecting to engines, instruments, Evolution autopilots and other network devices.
Tech Specs
Raymarine a127 12.1in MFD Combo w/Wi-Fi Bluetooth US LNC Vector Charts additional features:
Fast and Responsive Chart Plotting
The a9 and a12 feature Raymarine’s most advanced chartplotter engine with multitouch pinch-to-zoom. Every a9 and a12 also features:
A built-in, 50-channel, 10 Hz GPS for fast and smooth vessel tracking
GPS and Russian EGNOS support for faster acquisition and improved accuracy
WAAS and EGNOS Satellite Based Augmentation System (SBAS) support for satellite differential corrections
Optional external GA150 antenna for challenging below-deck applications
Dual-slot MicroSD card reader with support for both Raymarine LightHouse and Navionics charts
Free raster and vector USA charts (available for free download on Raymarine.com)
Multitouch pinch-to-zoom
Every Raymarine LightHouse II Multifunction display is compatible with Navionics , Silver, Gold, Platinum , HotMaps and HotMaps charts


